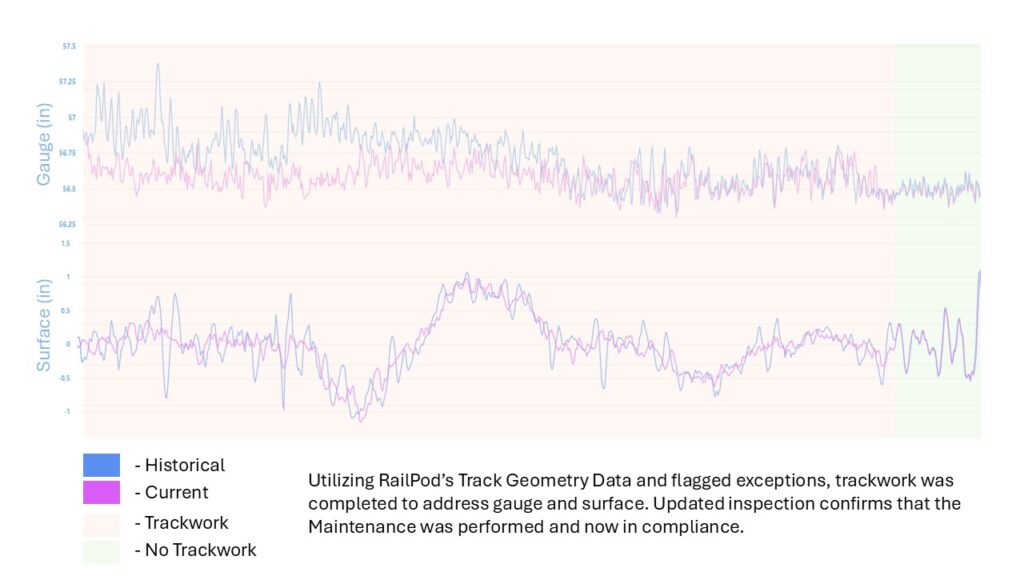
Track Geometry
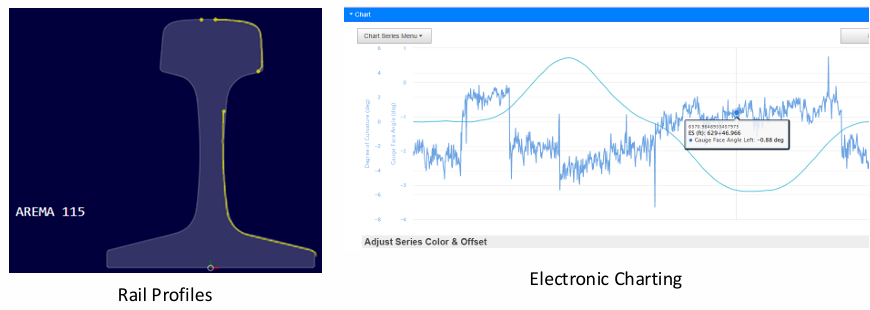
Rail Profiles
Measures horizontal wear, vertical wear, gauge face angle, rail cant, and rail size/type. Customers are able to compare differences in rail wear measurements over time with run-on-run comparisons.
Tabulated data organizes rail wear by tangents, curves, and rail type, helping prioritize low- or high-rail replacements and maintenance on critical curves
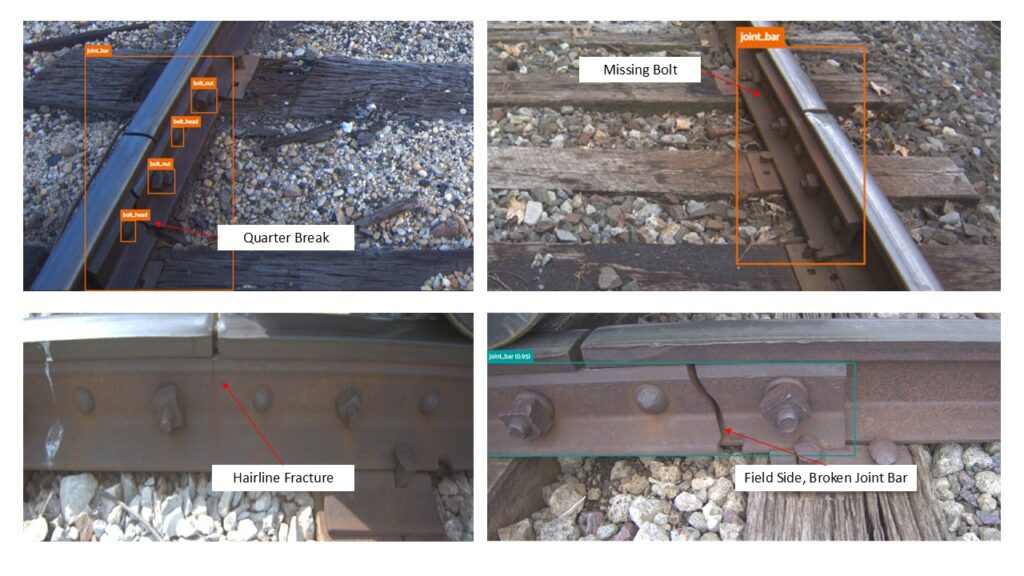
Joint Bars
Ties
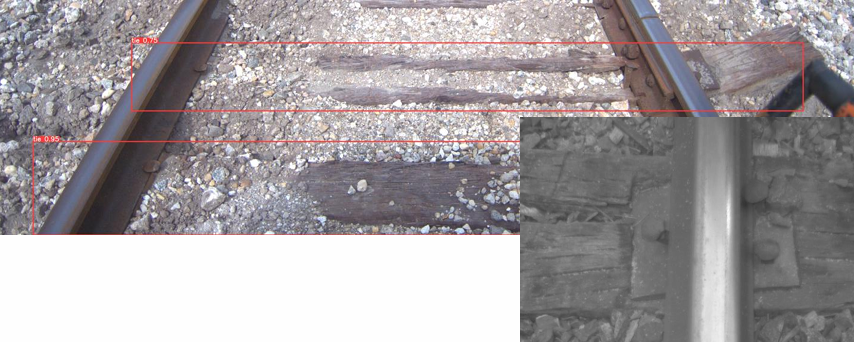
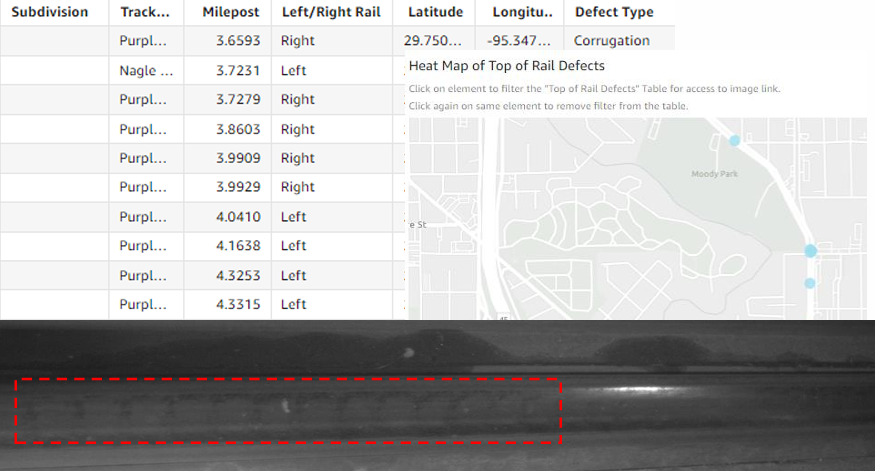
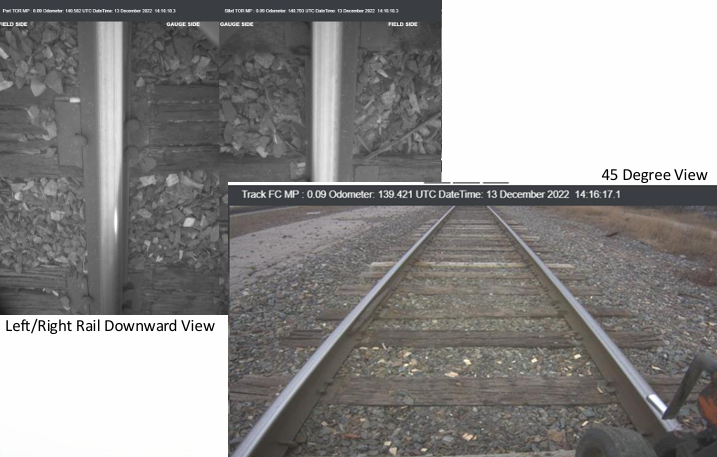
Top of Rail
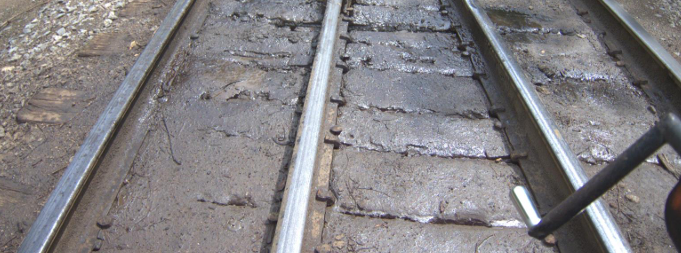
Grooved Rail
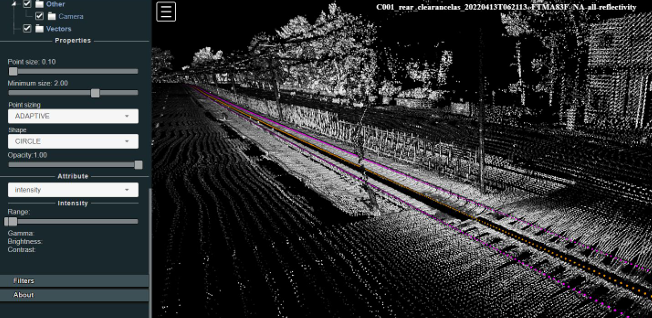
360 Degree LiDAR
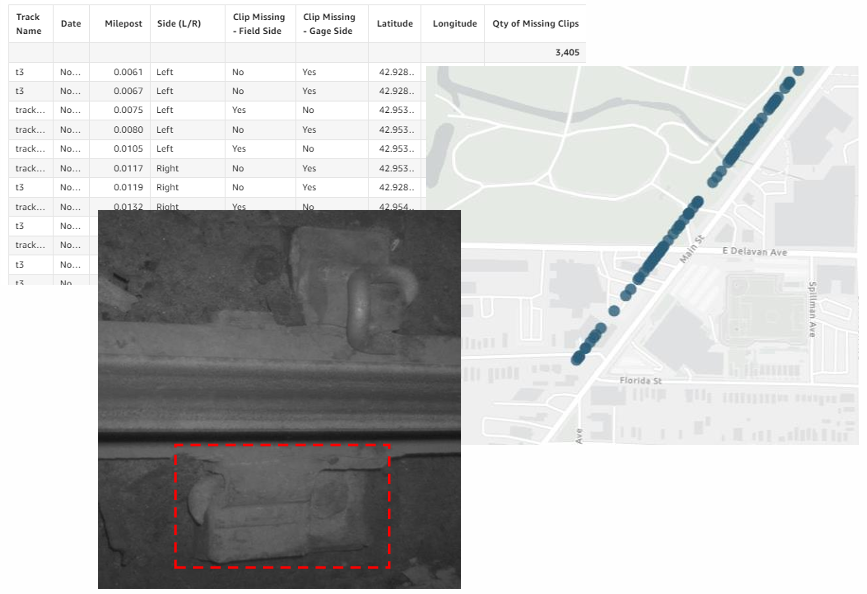
Fasteners
Ballast
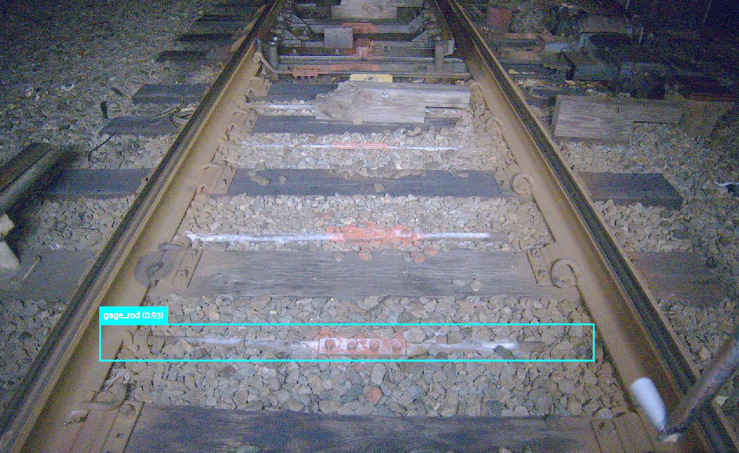
Gauge Rods
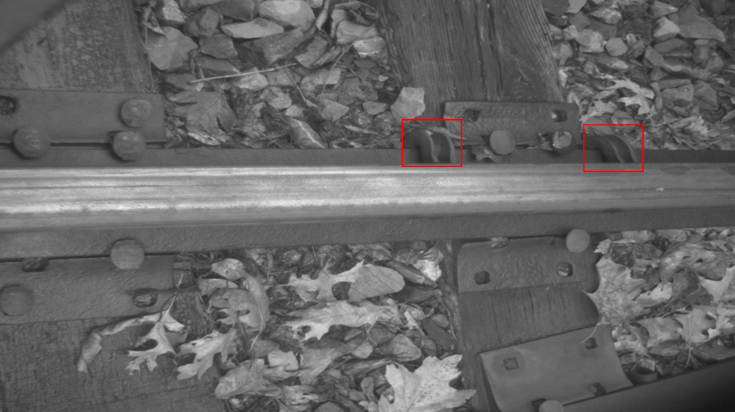
Tie Anchors
Overhead Catenary Height/Stagger
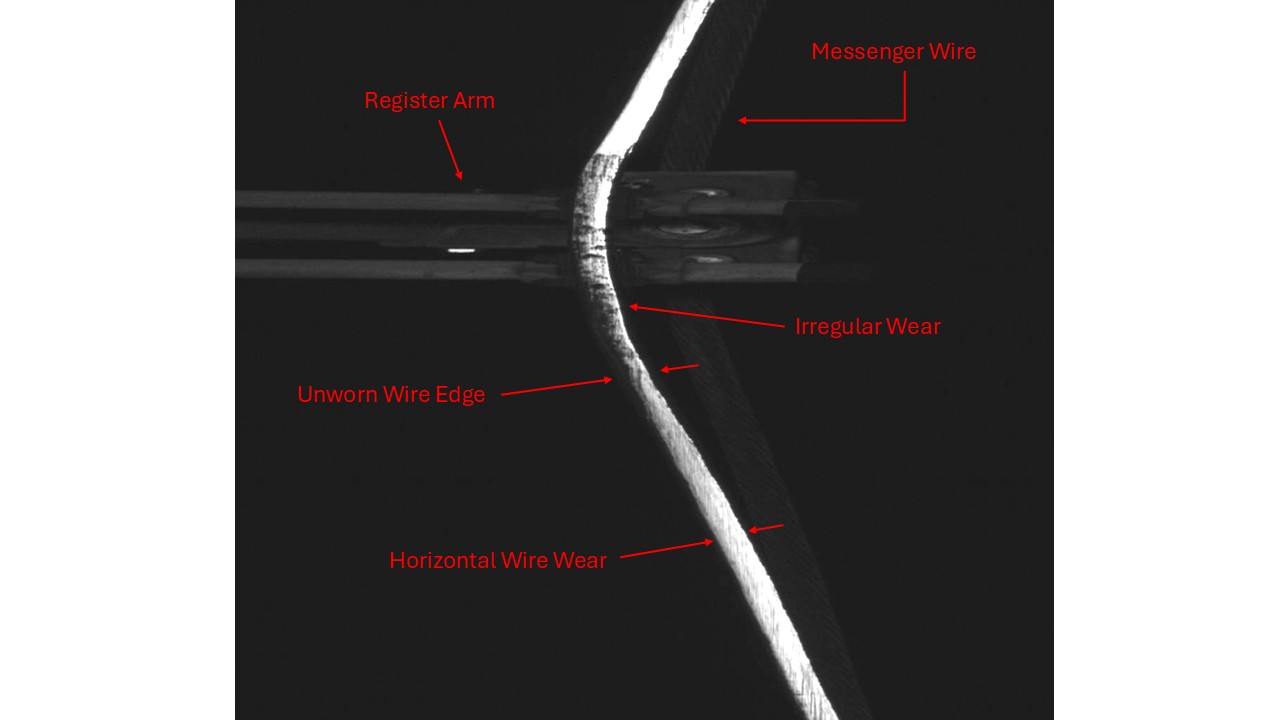
Overhead Catenary Wire Wear
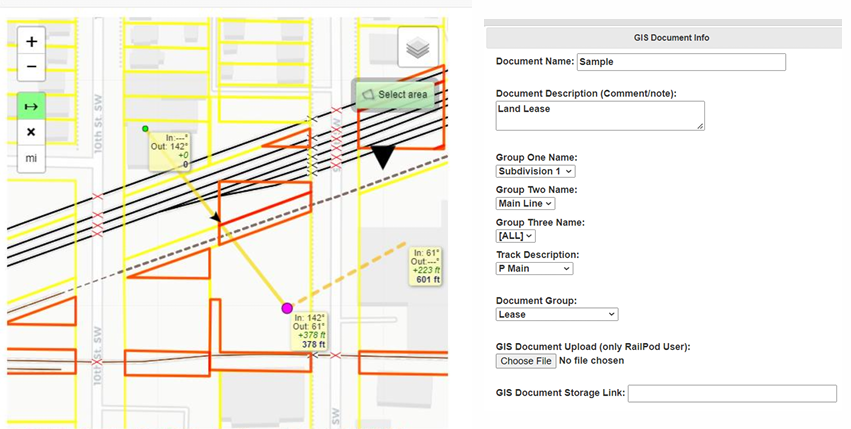
GIS/Asset Mapping
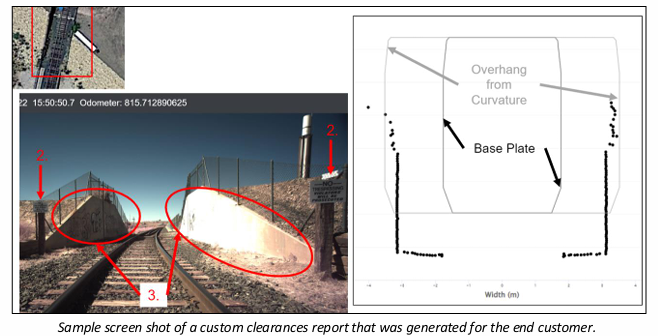
Clearance Studies